dist_plot#
- normtest.filliben.dist_plot(axes, test=None, alphas=[0.1, 0.05, 0.01])[source]#
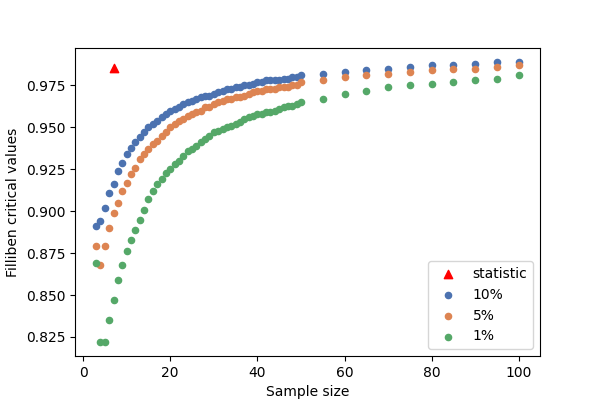
This function generates axis with critical data from the Filliben Normality test [1].
- Parameters:
- axesmatplotlib.axes.SubplotBase
The axis of the graph;
- testtuple (optional), with two elements:
- statisticfloat (positive)
The test statistic;
- sample_sizeint
The sample size. Must be equal or greater than
4;
- alphaslist of floats, optional
The significance level (\(\alpha\)) to draw the critical lines. Default is [0.10, 0.05, 0.01]. It can be a combination of:
0.005;0.01;0.025;0.05;0.10;0.25;0.50;0.75;0.90;0.95;0.975;0.99;0.995;
- Returns:
- axesmatplotlib.axes.SubplotBase
The axis of the graph;
References
[1]FILLIBEN, J. J. The Probability Plot Correlation Coefficient Test for Normality. Technometrics, v. 17, n. 1, p. 111-117, 1975.
Examples
>>> from normtest import filliben
>>> import matplotlib.pyplot as plt
>>> fig, ax = plt.subplots(figsize=(6, 4))
>>> filliben.dist_plot(axes=ax, test=(0.98538, 7))
>>> # plt.savefig("filliben_paper.png")
>>> plt.show()